Mapping the path to success: Unleash the power of precision with Our Geo-Informatics Services!
Data Visualization Services We Offer
Reports & Dashboards Development
- Strategic dashboards for C-suite managers to monitor KPIs across the company.
- Tactical dashboards for mid-level management.
- Operational dashboards for managers to monitor business processes, identify bottlenecks, etc.
- Analytics dashboards for data experts to identify trends, build forecasts.
Data Analytics & BI Platform Development
- Set up ETL/ELT processes to integrate data from diverse sources.
- Create a centralized repository, OLAP cubes, etc.
- Implement data security and data quality management.
- Set up data reporting and visualization.
Data Visualization Optimization
- Data source(s).
- Data model.
- Visualizations (dashboards, reports, paginated reports, etc.).
- Environment (data gateways, access controls, network, etc.).
How We Arrange Our Data Visualization Services
- Data visualization needs elicitation and analysis.
- Collection, documentation, and prioritization of the requirements for future reports & dashboards, an optimized data visualization solution, or a new or upgraded data analytics solution.
- Data visualization time and budget estimations.
- Data visualization cost-benefit analysis, ROI estimation.
- Data visualization project roadmapping.
- Risk management strategy definition for a data visualization project.
Based on the chosen service option, our team delivers:
- Data analytics and data visualization solution design, tech stack selection.
- Optimal dashboards layouts and convenient data representation options for different user roles.
- Data platform components (a data lake, ETL processes for each data source, a data warehouse, OLAP cubes, ML models, reports and dashboards, etc.).
- Data quality management.
- Data security.
- Data platform or data visualization performance tuning and evolution (adding new data sources, configuring additional reports, etc.).
- Knowledge transfer to your internal team/outsourced support team.
- Training sessions targeted at each user group with a detailed explanation of the delivered reports and dashboards, components and functions of the data visualization solution or the data platform.
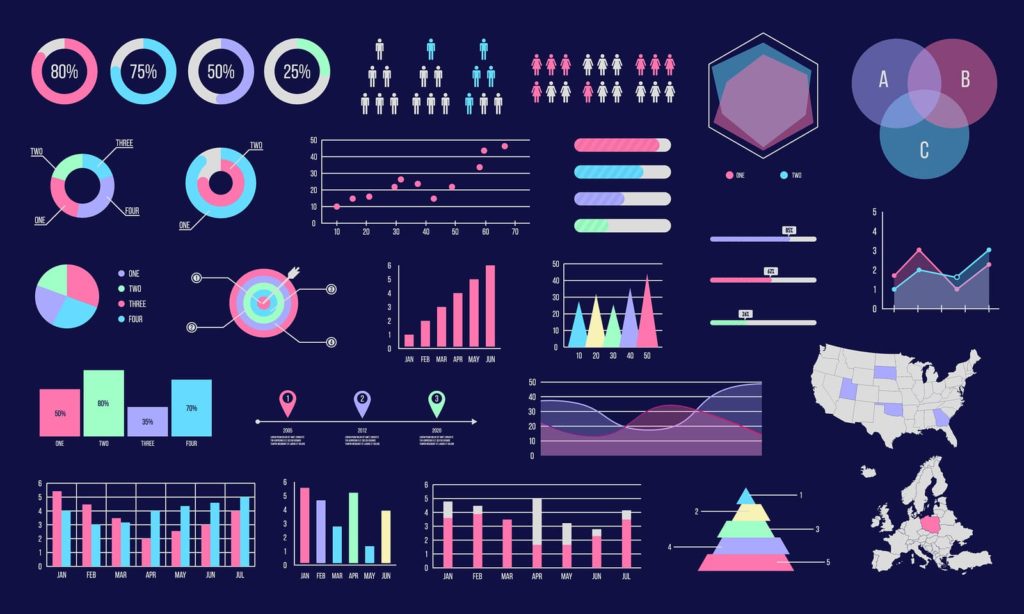
Data Visualization Techniques We Use
Symbol maps
Line charts
Bar charts
Pie charts
Donut charts
Heat maps
Funnel charts
Connectivity charts
Scatterplots
Sparklines
Matrices
Pivot tables
Gauge charts
Waterfall charts
Card charts
Custom charts, etc.
Pricing Options for Data Visualization Services
Fixed Price
- Small data visualization projects with clear and stable requirements.
- Data platform feasibility study and PoC.
Time & Material, Time & Material With A Cap
- Data visualization projects with unclear scope.
- Data visualization optimization.
- Advisory data visualization activities (business analysis, data analytics platform solution architecture design, etc.),
Data Visualization Challenges We Solve

Not Insightful Reports & Unanswered ‘Why?’
We make data visualization an indispensable part of the reporting process and enable decision-makers with the drill-down and filtering options to answer their business questions quickly.

Overloaded Reports & Dashboards
We design reports and dashboards ensuring that trends or outliers are recognized immediately, colors are relevant and chart types are consistent.

Disregarded User Roles
We tailor reports and dashboards so that every user can focus on relevant data.

Limited Reporting Flexibility
We enable visualization of analytics insights on all devices – PC, mobile, large screens. We can also add BI capabilities to your existing solutions.
Technologies We Master
Big Data


Clouds


Data Storage


Data Visualization


DWH services and databases


Front-end programming languages


Big Data


Clouds


Data Storage


Data Visualization


DWH services and databases


Front-end programming languages


